



Advantages over MES
- ready to go in no time
- simple
- cost-effective

autfactory collects production data directly on the shop floor, calculates your OEE in real time and identifies where downtime, cycle time losses, and quality losses occur.
autfactory integrates machine, production, quality, and trouble data in real time. This allows you not only to view your OEE, but also to identify where performance is being lost, the underlying causes, and specific areas for optimization.
Even small improvements can have a big impact: +1% OEE can generate five- to six-figure annual savings, depending on the line, without the need for new machinery.
In practice, these levers appear particularly frequently among the top losses:
Excel and BI solutions can display key performance indicators. autfactory links the analysis directly to machines, control systems, and the actual process on the shop floor. Existing MES, ERP, MDE/BDE, or BI systems do not necessarily need to be replaced; instead, they can be supplemented in a targeted manner.






autfactory combines industrial software with many years of experience in machinery, control systems, test benches, and real-world production processes.
Existing machines, control systems, and software solutions can be integrated into the data collection process.
Compare OEE, performance, downtime, and quality across individual machines, production lines, departments, and sites.

An OEE metric alone does not improve a process. autfactory shows when, where, and why performance is being lost.
From machine connectivity to live operation, initial transparency can be achieved within just a few weeks.

Structured production data provides the foundation for Predictive Quality, artificial intelligence, and future process optimization.

Definition of requirements & comparison of existing systems at your site.

2-4 weeks for machine connection of all signals.

Commissioning & training. Full transparency on the shop floor.
What’s special about our licensing model:
Unlimited number of users and variables.
NO additional costs!
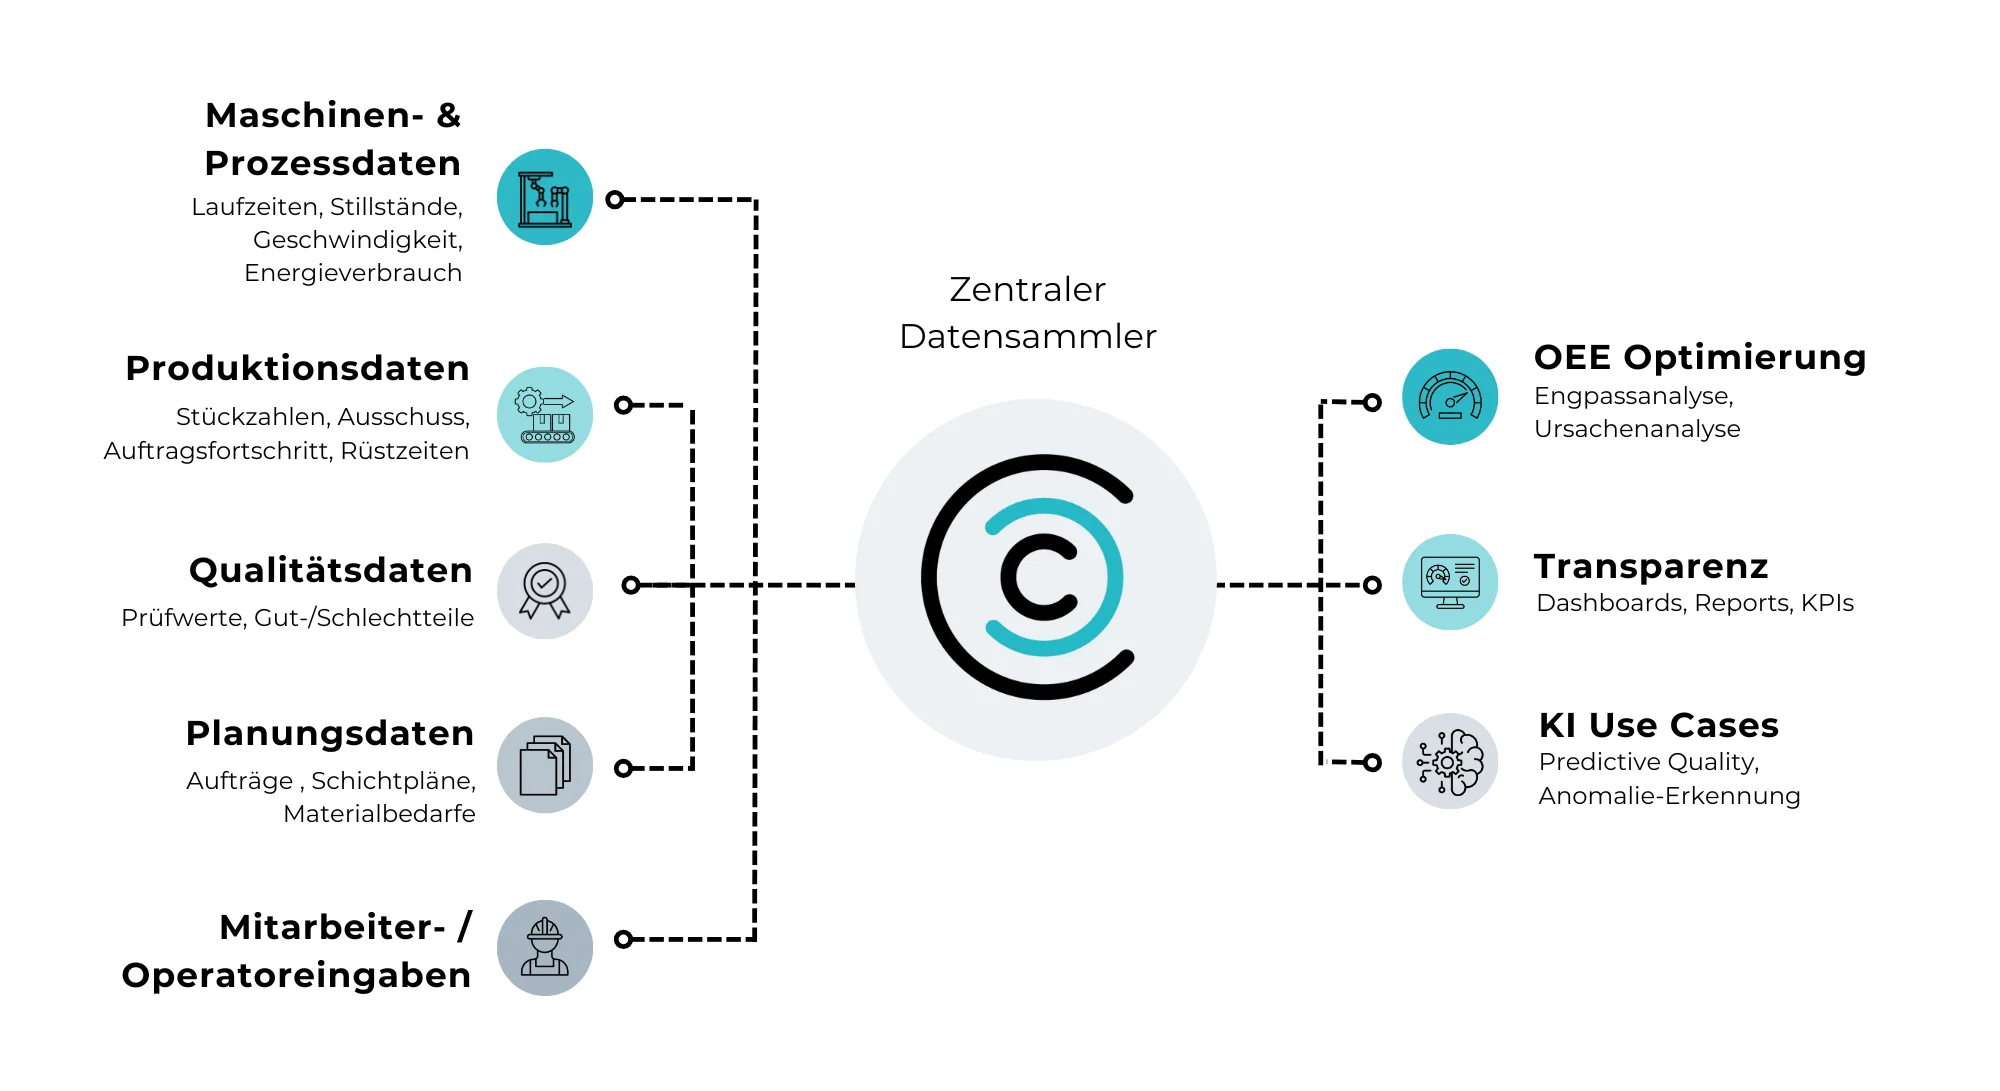
autfactory brings together machine, process, production, and quality data in a central data platform. Both modern and legacy machines, as well as existing systems, can be integrated.
Key features:
The OEE live dashboard shows the current status of your production at a glance. Availability, performance, and quality are displayed alongside machine status, production output, and the daily target.
Key features:
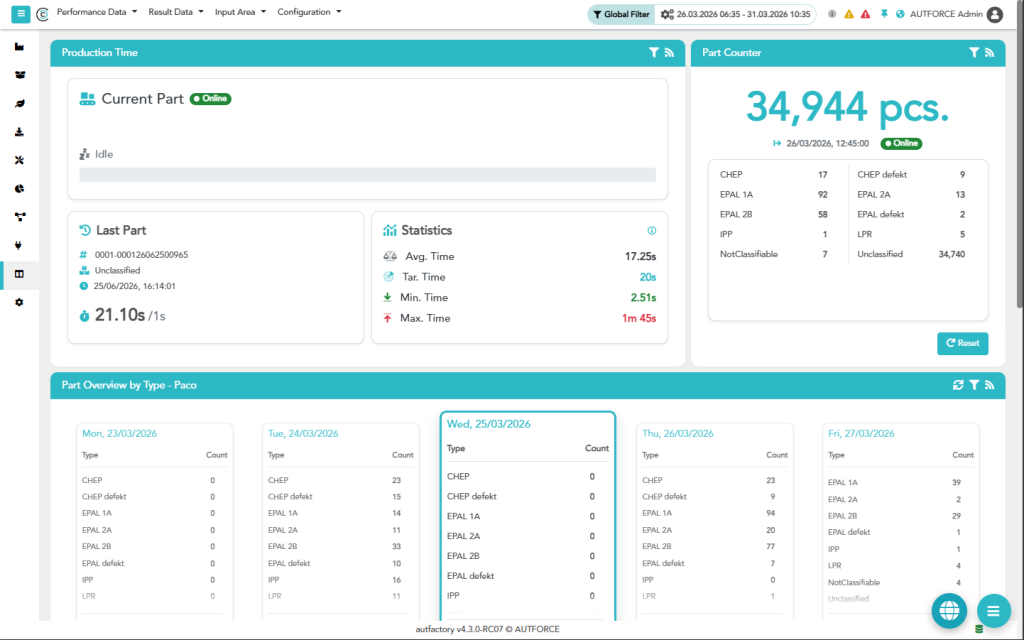
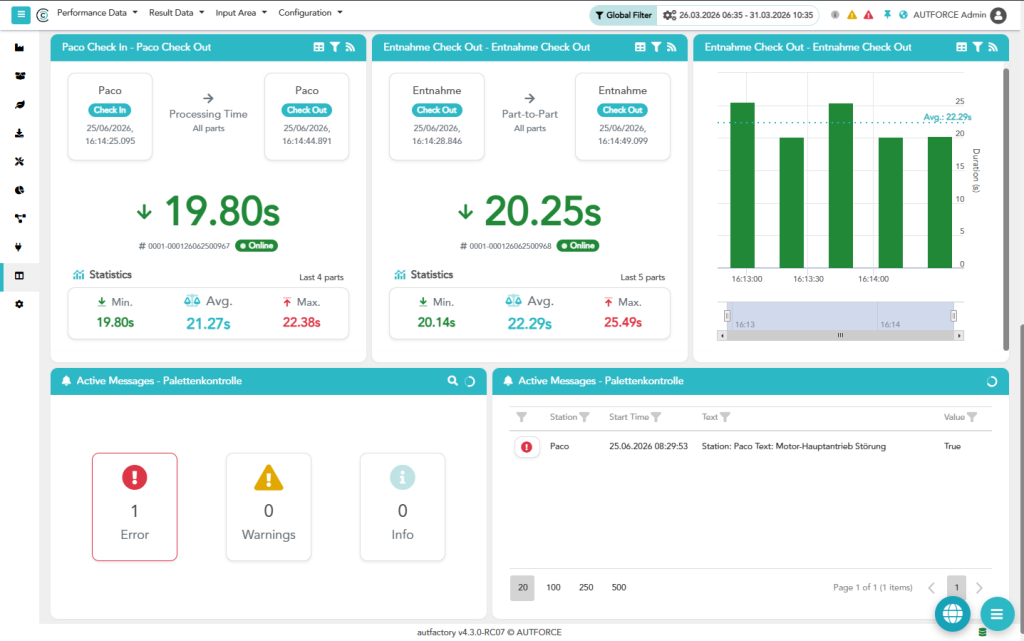
The production performance dashboard shows whether machines and production lines are operating at the intended speed. Target and actual cycle times, production quantities, and speed losses make performance deviations visible at an early stage.
autfactory makes the following KPIs visible:
Quality losses reduce actual production performance. autfactory links quality data with machines, products, orders, and shifts. This allows you to identify where scrap occurs and how quality develops over time.
Key features:
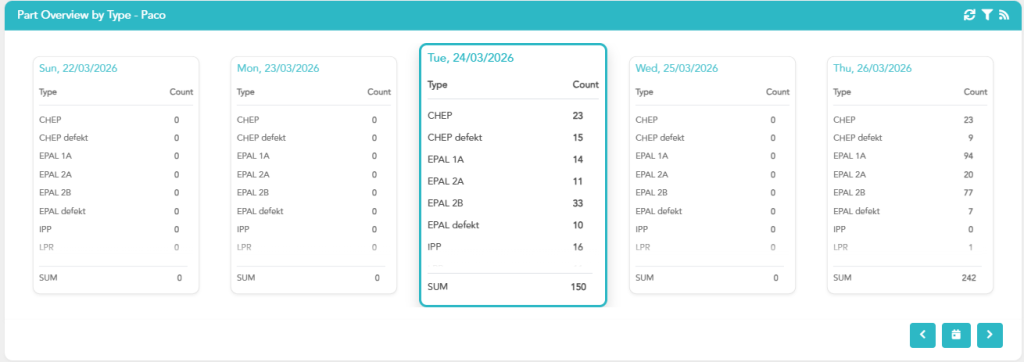
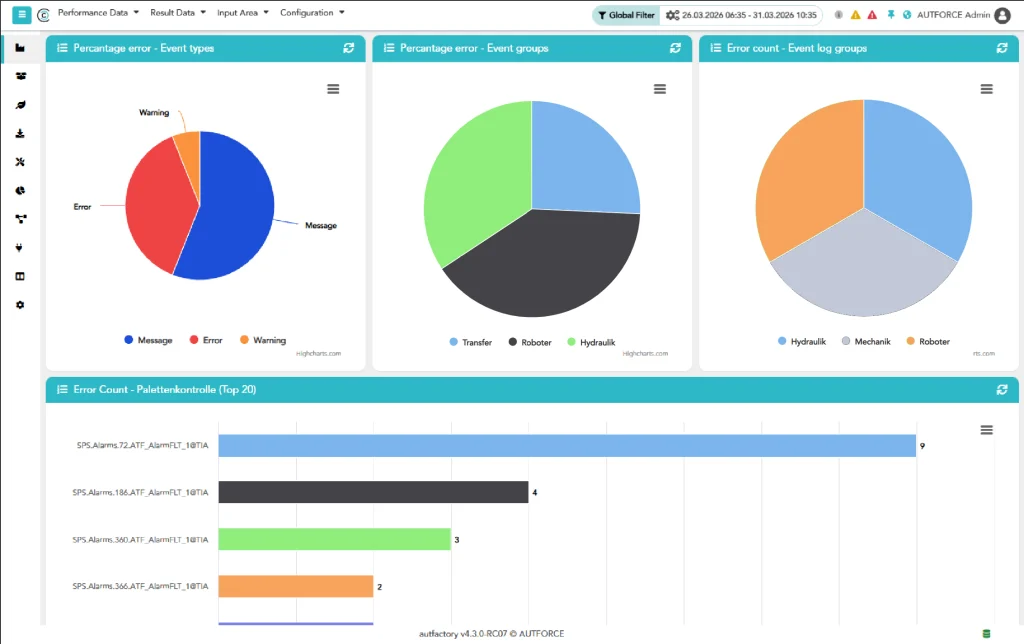
autfactory shows when a fault occurred, how long it lasted, and how often it recurs. This allows you to identify not only downtime, but also the main causes behind production losses.
Key features:
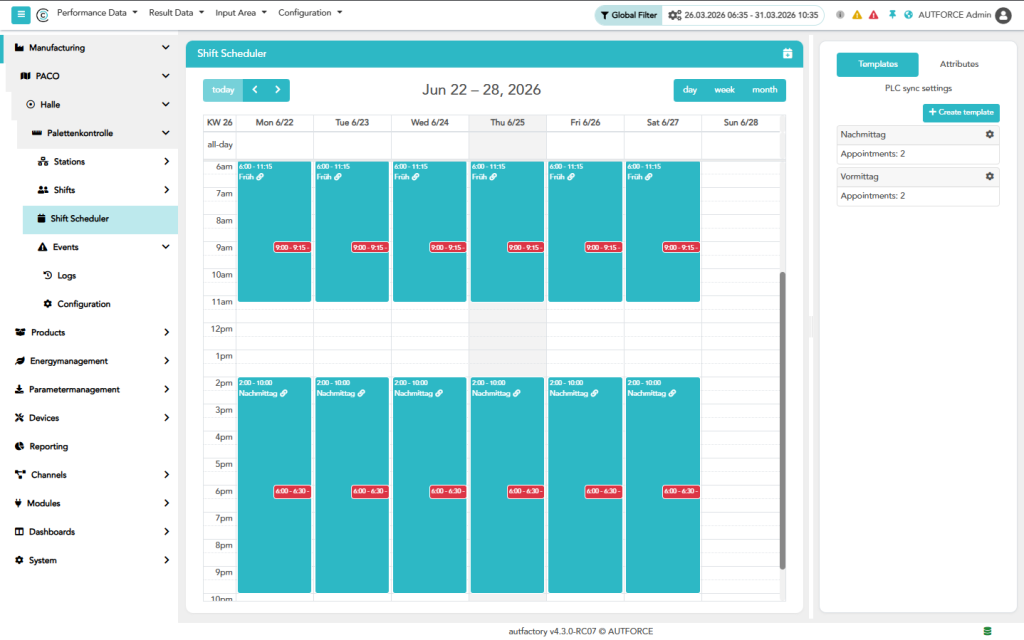
Compare OEE, production performance, downtime, and quality across different shifts and teams. The integrated shift calendar makes it easy to map shifts, breaks, maintenance activities, and planned downtime.
Key features:
The AI assistant enables users to analyze production data using natural language. Instead of manually creating reports, users ask a specific question and immediately receive the relevant analysis or visualization.
Example: “Show me the most common causes of faults during the last shift as a pie chart.”
The AI assistant analyzes the available data and automatically generates the requested analysis.
Key features:
In a short consultation, we assess which data is already available in your production and how quickly autfactory can create transparency.
Christoph Steiger
Industrial software expert
+43 (664) 59 78 668
[email protected]



You are currently viewing a placeholder content from reCAPTCHA. To access the actual content, click the button below. Please note that doing so will share data with third-party providers.
More Information