Clarify requirements
Definition of requirements & comparison of existing systems at your site.
OEE and TEEP: key performance indicators for maximum production efficiency
autfactory is the software for real-time monitoring and optimization of your machine performance: It automatically collects data, calculates relevant key figures, and identifies potential for increasing the efficiency of your production. For more output, less downtime, and increased availability.
The key performance indicator in this context is overall equipment effectiveness (OEE). A sound understanding of these indicators helps to identify and successfully implement targeted measures to optimize production efficiency.
Request a demo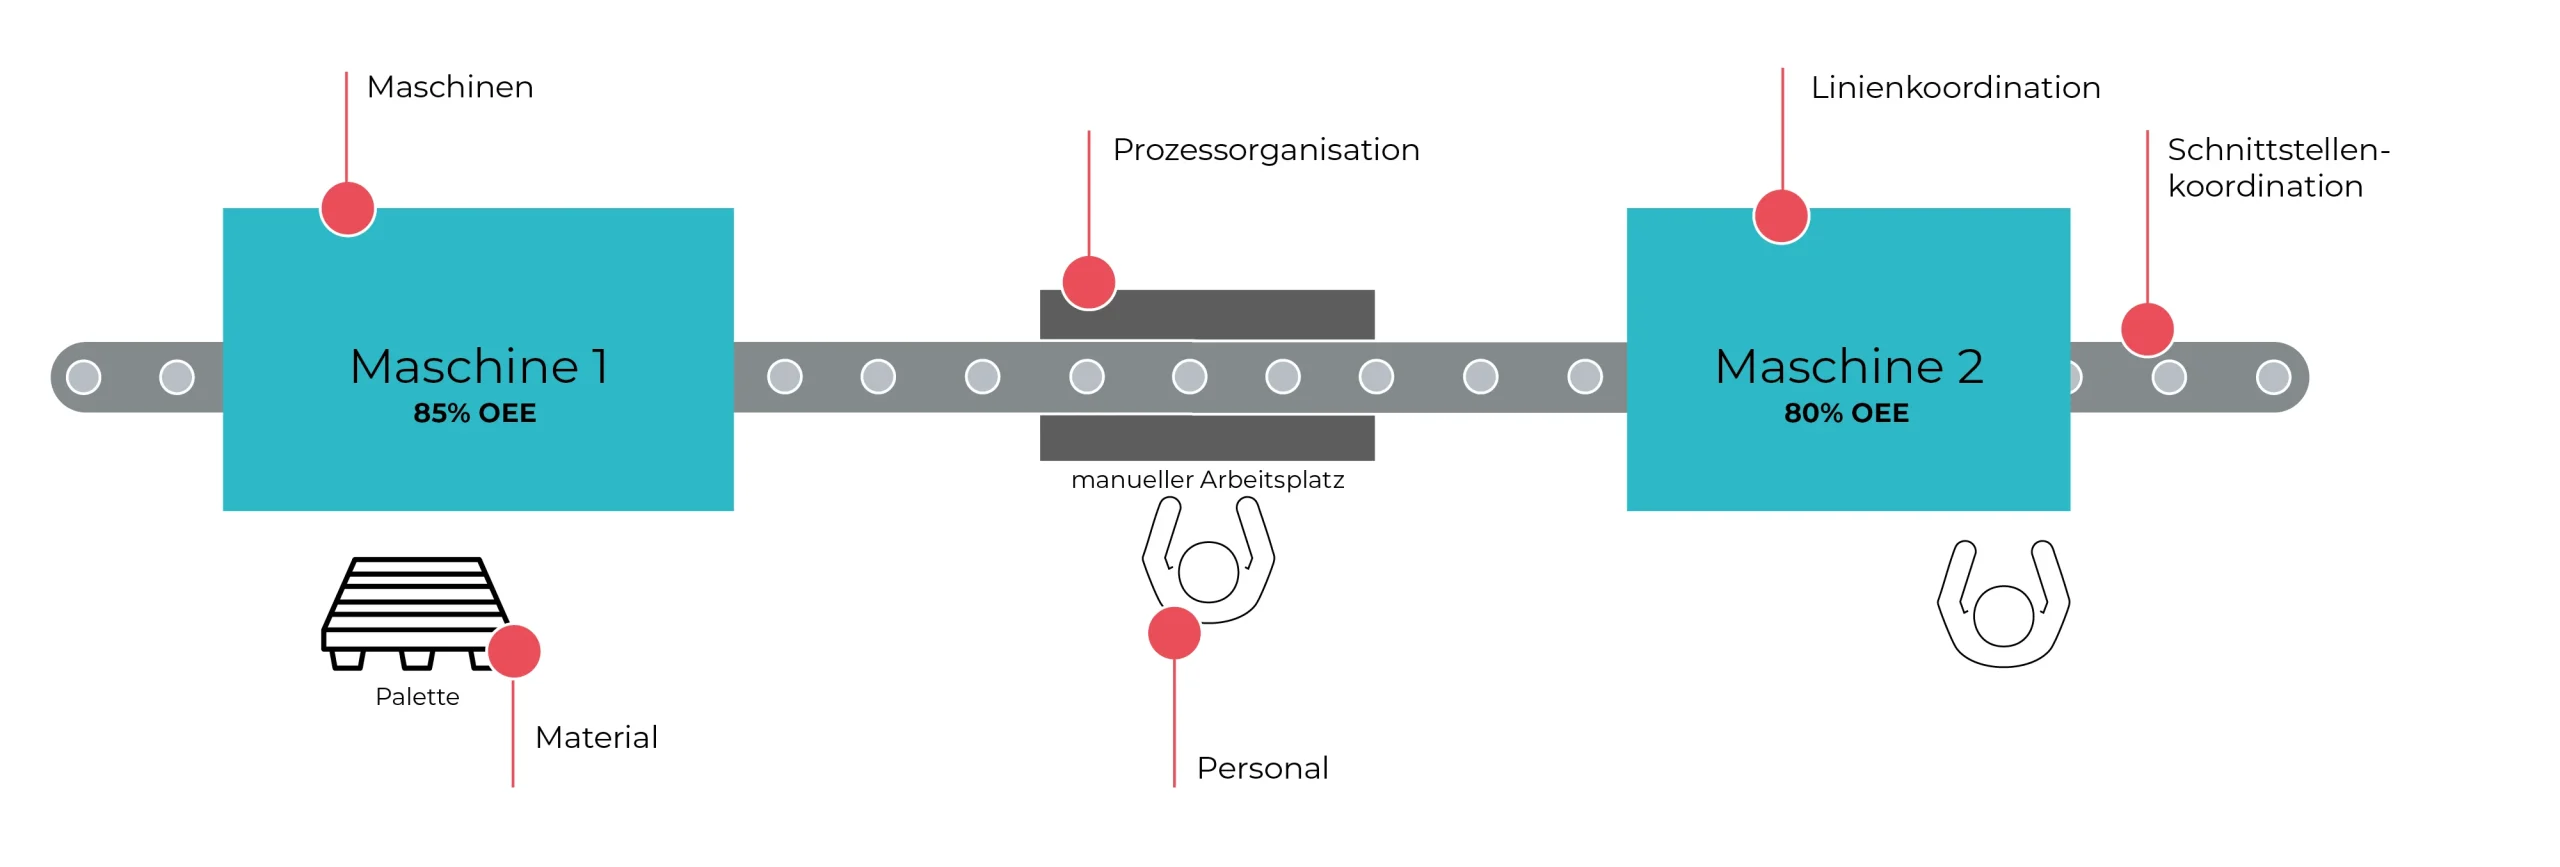
A machine with 85% OEE sounds impressive. But in reality, even the best individual value is of little use if a manual workstation slows things down or the material flow comes to a standstill. The key factor is not the OEE of a single machine, but the performance of the entire line. In every production process, the following applies: if one station stops, the entire value chain stops. Every standstill means zero production.
This is where traditional Excel analyses fall short. They show isolated key figures, but not the real causes. No dynamic dependencies. No live data. And therefore no solid basis for decision-making with regard to improvements.
Get in touch & see your actual performanceOur production optimization software autfactory links all relevant influencing factors along the line:

Definition of requirements & comparison of existing systems at your site.

2-4 weeks for machine connection of all signals.

Commissioning & training. Full transparency on the shop floor.
What’s special about our licensing model:
Unlimited number of users and variables.
NO additional costs!
autfactory collects all relevant production data in a central system – regardless of the machine, control system, or existing IT infrastructure.
What data autfactory collects:
All information is automatically recorded, standardized, and archived. This creates a reliable database for tracking your machine performance.
Request a Brownfield Quick Check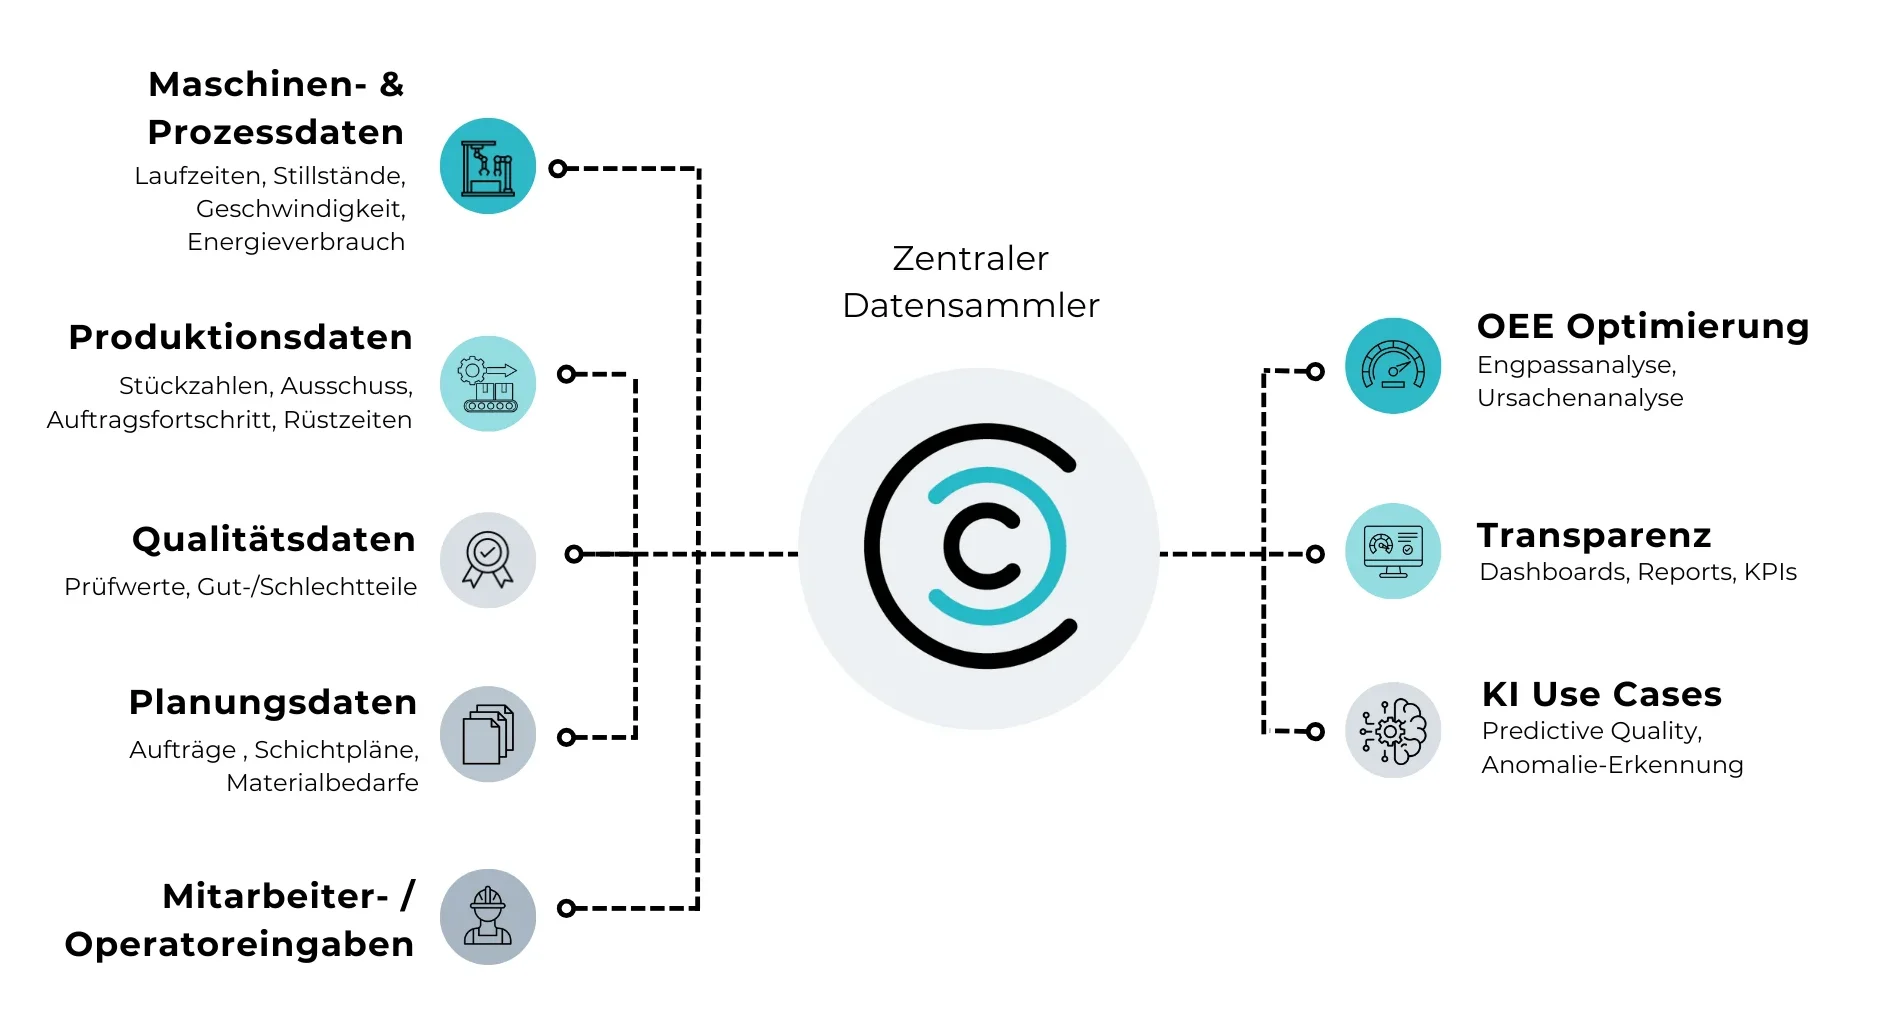
Even small improvements can have a big impact: +1% OEE can generate five- to six-figure annual savings, depending on the line, without the need for new machinery.
Diese Hebel tauchen in der Praxis besonders häufig in den Top-Verlusten auf:
The reality in many manufacturing facilities: ERP, MES, QDAS, databases, measuring systems, control systems, bus and vision systems, industrial interfaces, maintenance, and operators are only loosely connected to each other. Each area maintains its own data—often even multiple times.
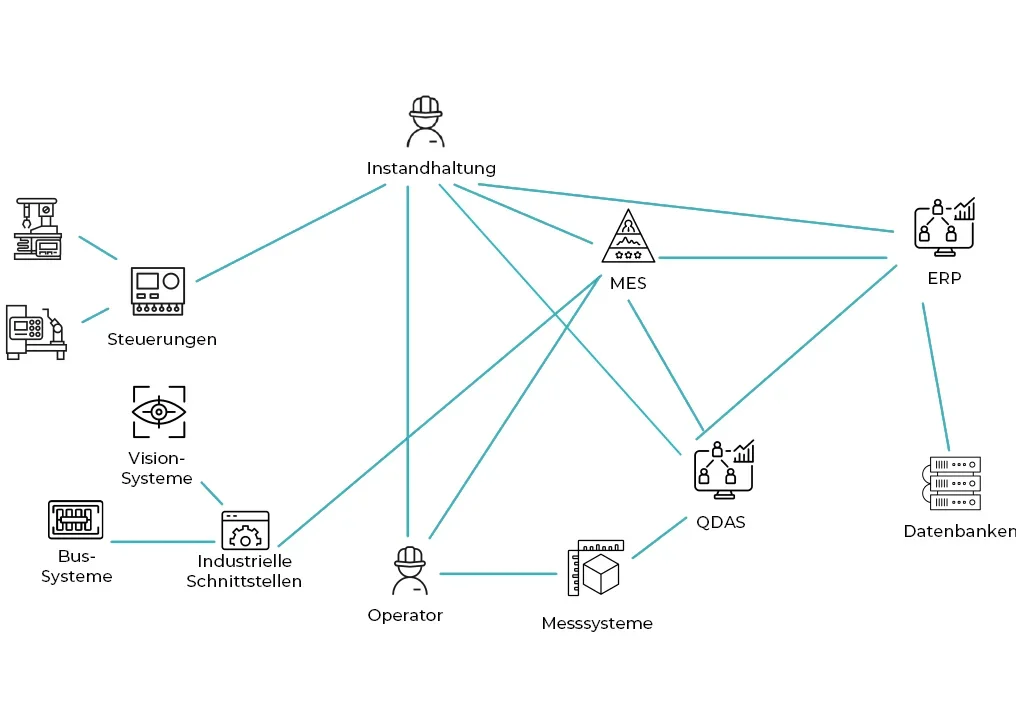
This leads to typical obstacles in machine performance tracking:
OEE determines the performance during planned production times and downtimes due to unplanned stoppages. This means that factors such as maintenance, breaks, public holidays and weekends or vacations are taken into account before the calculation. Production downtimes are only determined during planned production times. This key figure is therefore primarily suitable for recognizing and initiating a possible improvement in output.

TEEP, on the other hand, determines the maximum output with current effectiveness, i.e. assumes that a system is in operation 24 hours a day. This key figure is suitable for recognizing whether additional production times would make it possible to increase production or whether an additional system would be required.
Depending on the industry, different values can be achieved for OEE and TEEP. In highly automated areas, top productions can achieve OEE values of up to 90 %, while TEEP values of up to 80 % are considered realistic.
The two key figures are made up of four factors each. All are calculated as a percentage and combined by multiplication to form the respective key figures.

Availability is reduced by unplanned system downtimes during production. Missing material, broken system parts or malfunctions reduce the output of production systems. These losses are known as availability losses and are further subdivided into operational disruptions and set-up and changeover. The available production time is compared with the downtimes.

The output is defined as the number of parts produced compared to the target quantity. If the same number of parts were produced in a certain period as was planned, the performance is 100%.

The quality factor is the ratio of all parts produced to the number of parts produced without defects. If there are no faulty parts among all the parts that have been produced, the quality is 100%.

Utilization compares the currently planned production time with the total available time. It is not part of the classic OEE key figure, but belongs to the TEEP key figure (Total Effective Equipment Performance).
Let’s take your production to the next level together. Thanks to the automated data collection of our autfactory, the causes of losses can be identified and unused potential recognized. The data obtained can be used to initiate processes for continuous improvement
(CIP) in order to permanently increase productivity and optimize output. Whether in the home office or in production, on the tablet or on the PC – all data can be evaluated directly live. All you need is a web browser.
Get even more out of your production data and combine machine performance tracking with autfactory’s automated root cause analysis and early warning system!


At AUTFORCE, we specialize in testing systems & industrial software . Get in touch with us. Together we will find the best solution for your particular challenge!
Christoph Steiger
Industrial software expert
+43 (664) 59 78 668
[email protected]