Clarify requirements
Definition of requirements & comparison of existing systems at your site.
OEE and TEEP: key performance indicators for maximum production efficiency
autfactory automatically collects machine and process data, calculates OEE in real time, and identifies the sources of downtime, micro-stops, and performance losses.
Make quality your competitive advantage!
OEE per machine is great.
OEE across the entire line is essential.
And that’s what autfactory delivers – automatically and reliably.

OEE (Overall Equipment Effectiveness) shows how efficiently your production is running. With autfactory, you can easily identify opportunities for optimization and sustainably improve your OEE.
OEE Metrics: How Much Potential Does Your Manufacturing Operation Still Have?
autfactory collects all relevant production data in a central system – regardless of the machine, control system, or existing IT infrastructure.
What data autfactory collects:
All information is automatically recorded, standardized, and archived. This creates a reliable database for tracking your machine performance.
Brownfield-Quickcheck anfragen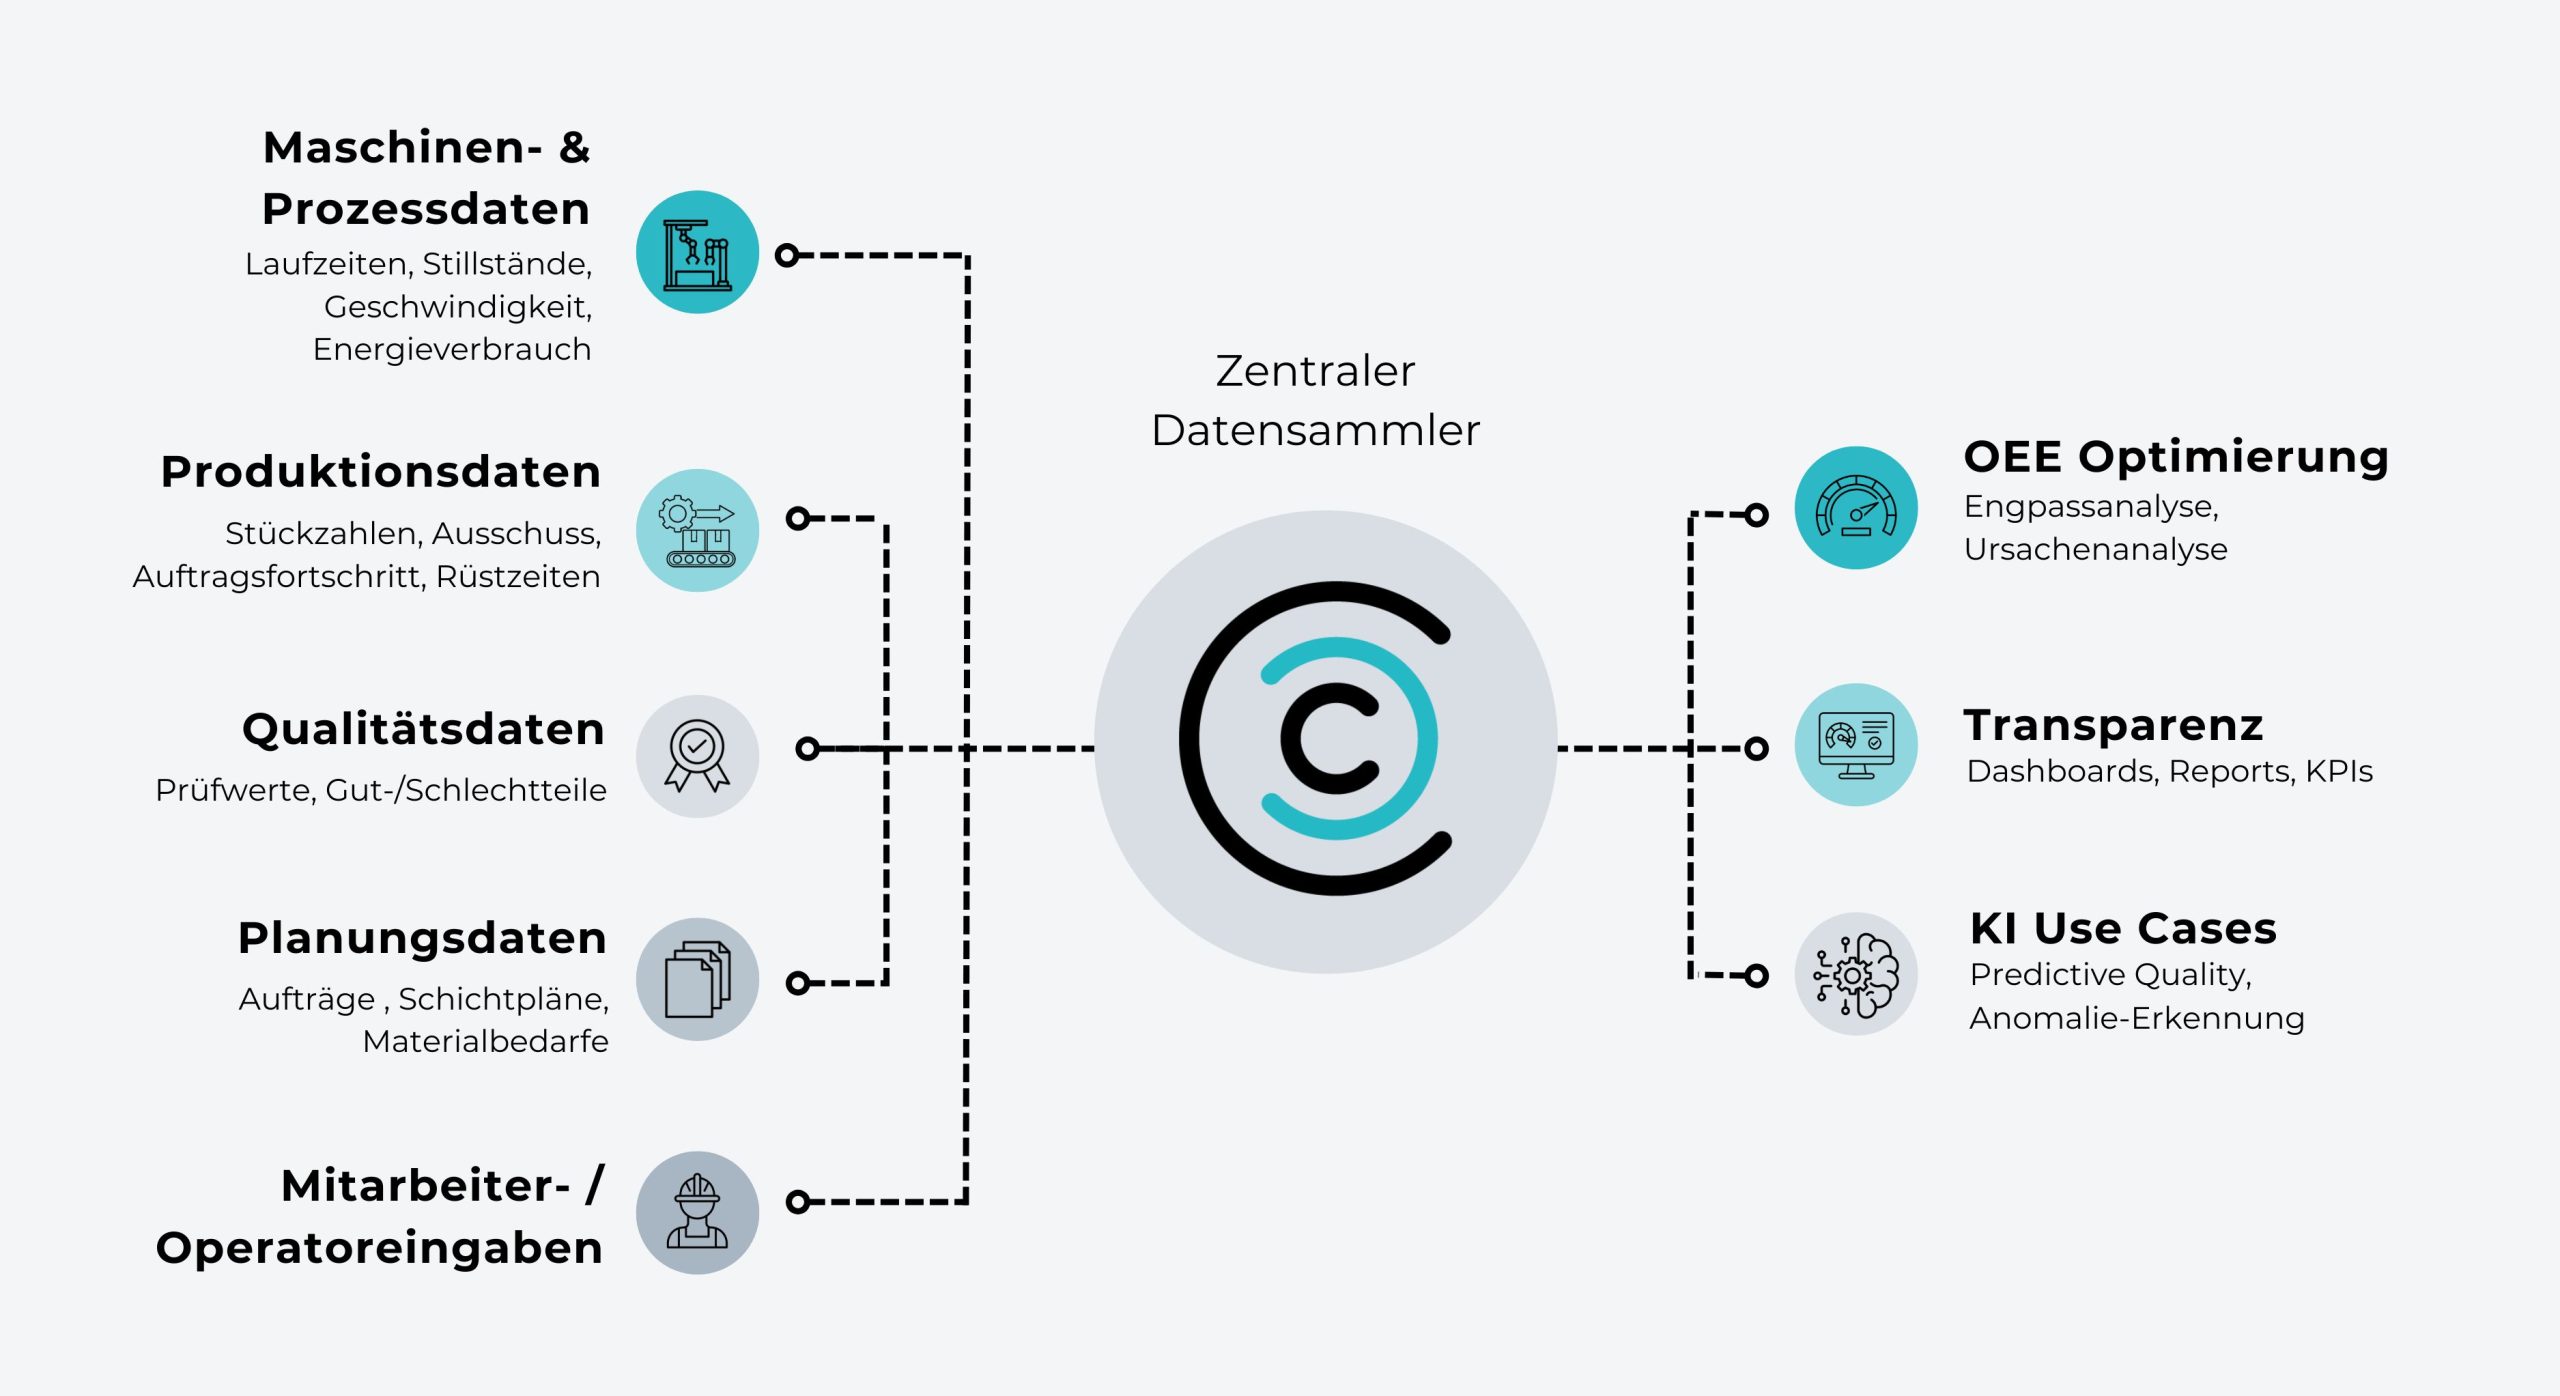
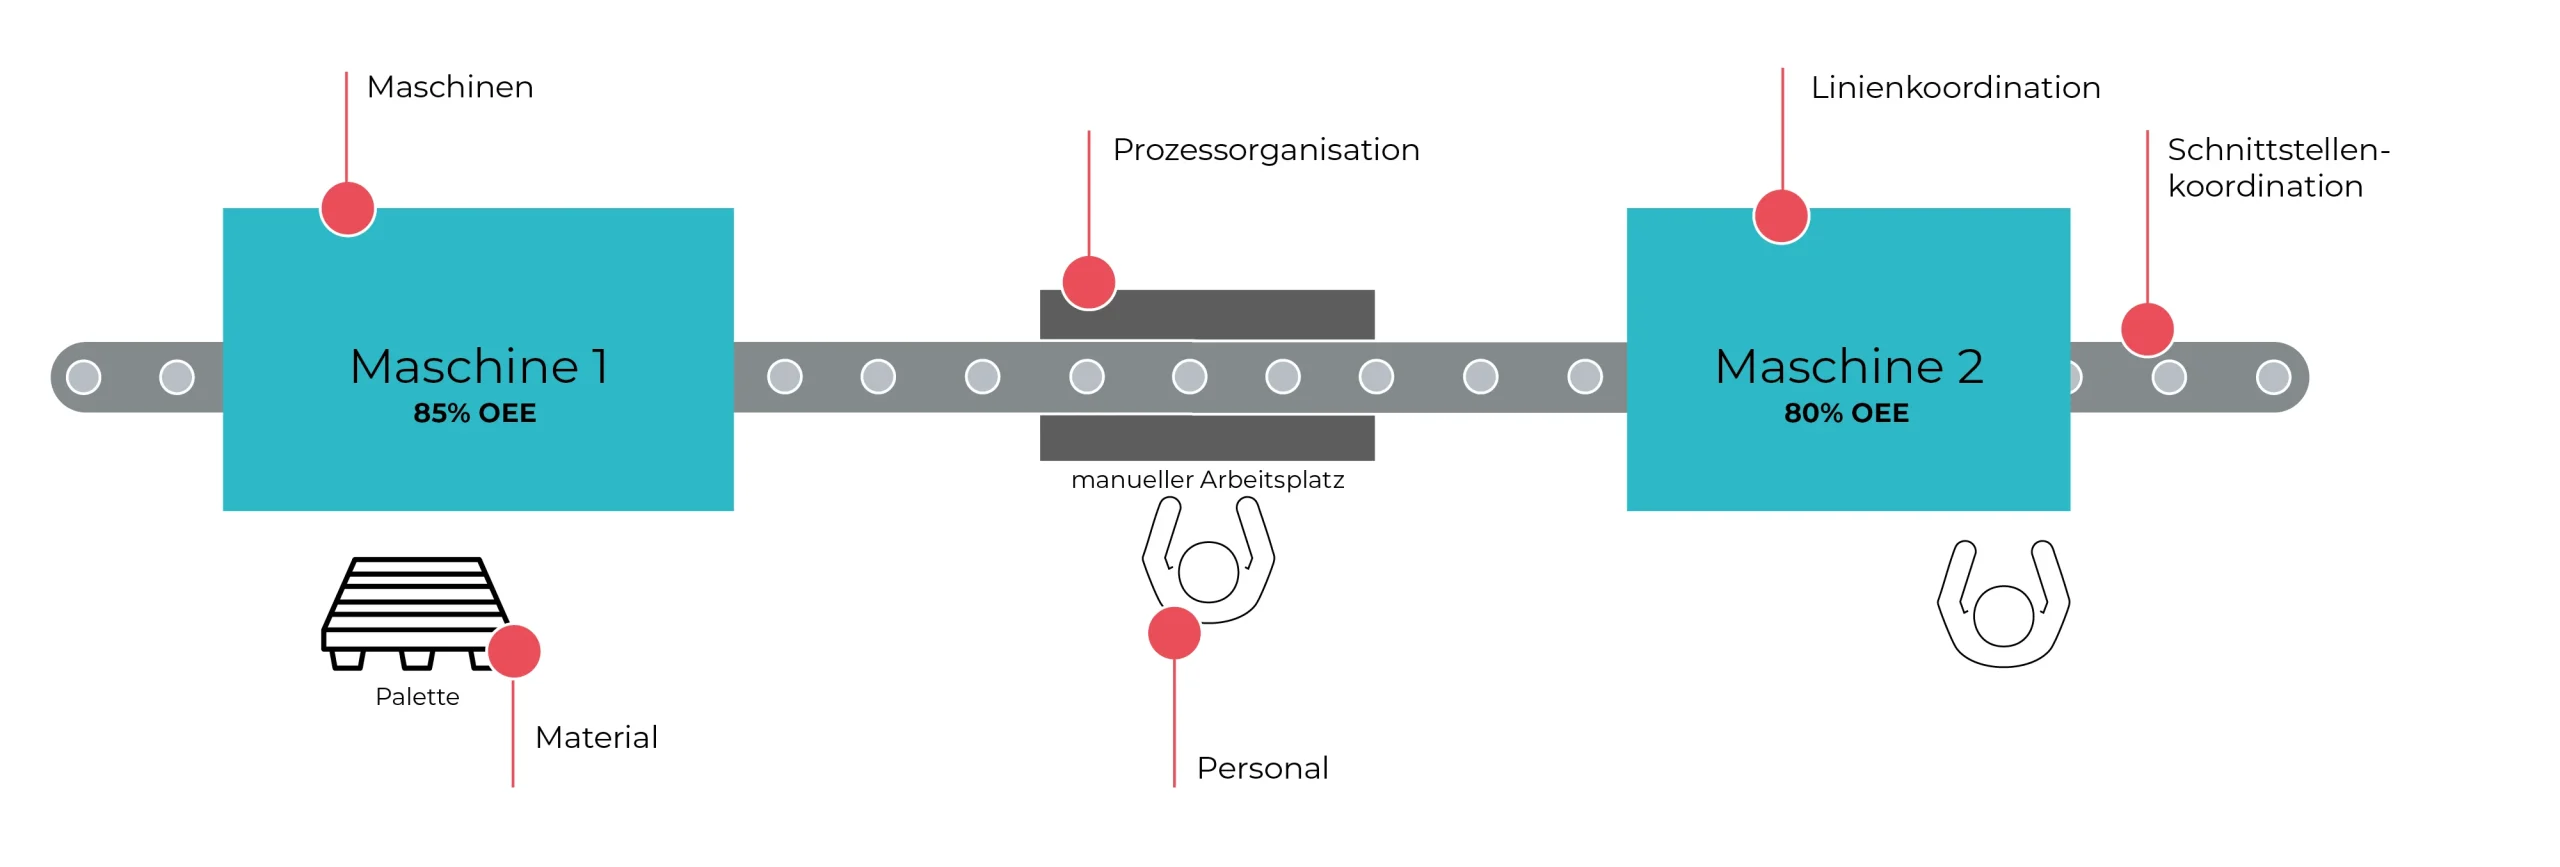
A machine with an 85% OEE looks impressive. But in reality, even the best individual performance is of little use if a manual workstation is holding things up or the flow of materials is stalled. The key factor is not the OEE of a single machine, but the performance of the entire line. In any production process, the following applies: If one station stops, the entire value chain comes to a halt. Any downtime means zero production.
This is where traditional Excel analyses fall short. They show isolated key figures, but not the real causes. No dynamic dependencies. No live data. And therefore no solid basis for decision-making with regard to improvements.
Kontakt aufnehmen echte Linienperformance sehenOur production optimization software autfactory links all relevant influencing factors along the line:
Even small improvements can have a big impact: +1% OEE can generate five- to six-figure annual savings, depending on the line, without the need for new machinery.
In practice, these levers appear particularly frequently among the top losses:

Definition of requirements & comparison of existing systems at your site.

2-4 weeks for machine connection of all signals.

Commissioning & training. Full transparency on the shop floor.
What’s special about our licensing model:
Unlimited number of users and variables.
NO additional costs!
The reality in many manufacturing facilities: ERP, MES, QDAS, databases, measuring systems, control systems, bus and vision systems, industrial interfaces, maintenance, and operators are only loosely connected to each other. Each area maintains its own data—often even multiple times.
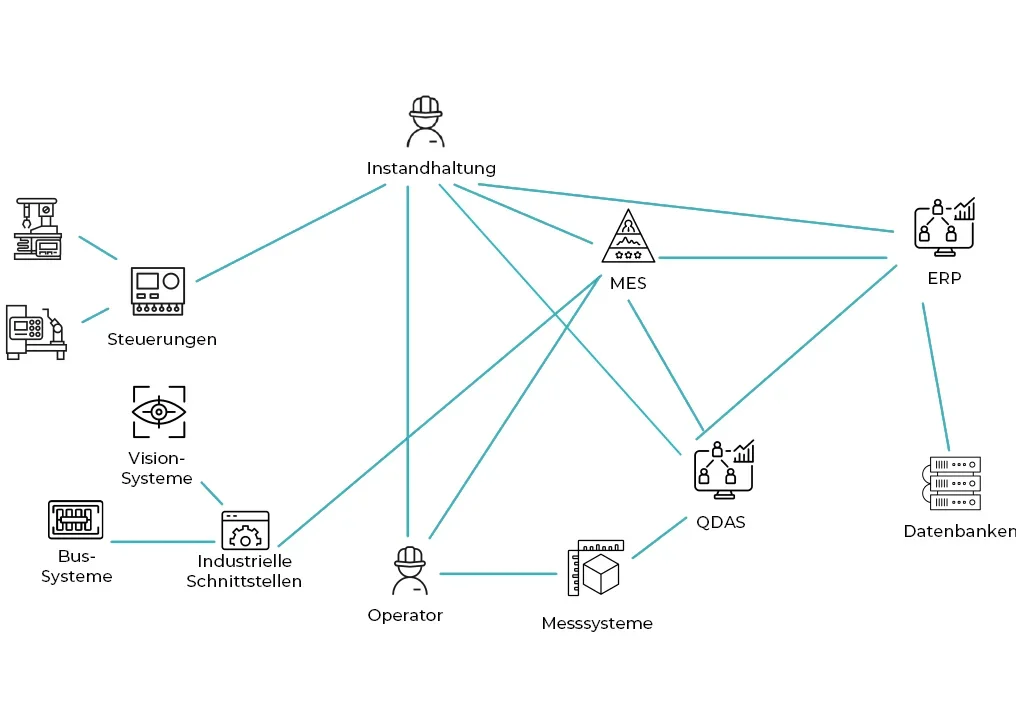
This leads to typical obstacles in machine performance tracking:

At AUTFORCE, we specialize in testing systems and industrial software. Get in touch with us. Together we will find the best solution for your particular challenge!
Christoph Steiger
Industrial software expert
+43 (664) 59 78 668
[email protected]